Utah Jazz 118, Houston Rockets 125
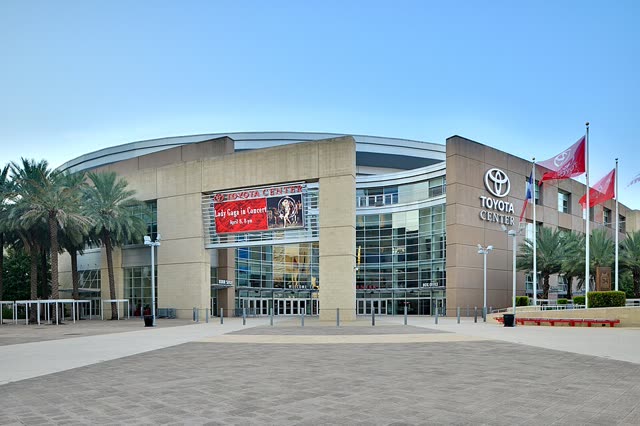
Final · Toyota Center (Houston) · Houston, TX · 18,055 in · line HOU -15.5 · o/u 221.5
| Team | 1 | 2 | 3 | 4 | T |
|---|---|---|---|---|---|
| Utah Jazz | 27 | 26 | 36 | 29 | 118 |
| Houston Rockets | 27 | 36 | 29 | 33 | 125 |
Leaders
UTAH
-
 Darryn Peterson
Points28
-
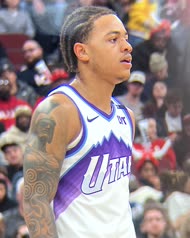 Keyonte George
Assists7
-
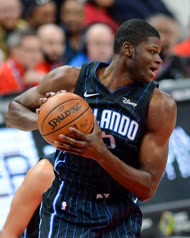 Mo Bamba
Rebounds9
HOU
-
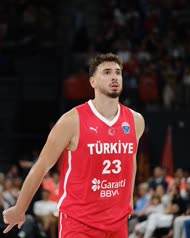 Alperen Sengun
Points43
-
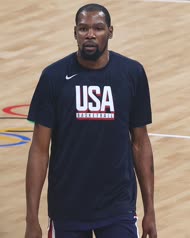 Kevin Durant
Assists6
-
Alperen Sengun
Rebounds12
Team stats
| UTAH | HOU | |
|---|---|---|
| 41-89 | Field Goals Made-field Goals Attempted | 43-91 |
| 46 | Field Goal Pct | 47 |
| 15-41 | Three Point Field Goals Made-three Point Field Goals Attempted | 12-34 |
| 37 | Three Point Field Goal Pct | 35 |
| 21-26 | Free Throws Made-free Throws Attempted | 27-34 |
| 81 | Free Throw Pct | 79 |
| 41 | Total Rebounds | 47 |
| 13 | Offensive Rebounds | 18 |
| 28 | Defensive Rebounds | 29 |
| 20 | Assists | 25 |
| 4 | Steals | 2 |
| 4 | Blocks | 8 |
| 10 | Turnovers | 8 |
| 3 | Team Turnovers | 0 |
| 13 | Total Turnovers | 8 |
| 1 | Technical Fouls | 0 |
| 1 | Total Technical Fouls | 0 |
| 0 | Flagrant Fouls | 0 |
| 18 | Turnover Points | 8 |
| 18 | Fast Break Points | 8 |
| 46 | Points In Paint | 52 |
| 25 | Fouls | 21 |
| 10 | Largest Lead | 12 |
| 11 | Lead Changes | 11 |
| 21 | Lead Percentage | 69 |