Buffalo Sabres 2, San Jose Sharks 0
Buffalo Sabres v San Jose Sharks
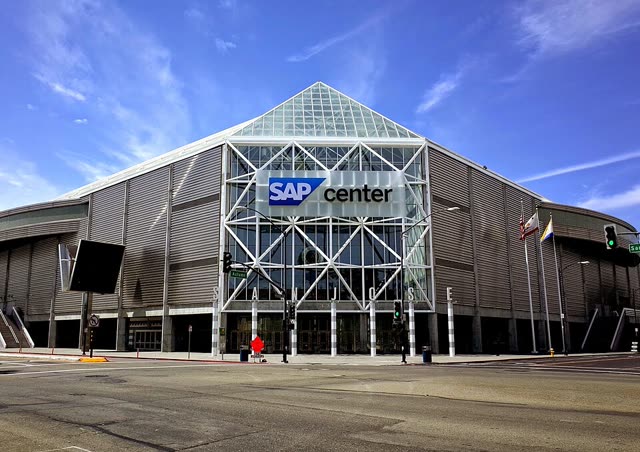
Final · SAP Center at San Jose · San Jose, CA · 14,900 in · line BUF -155 · o/u 6.5
| Team | 1st | 2nd | 3rd | T |
|---|---|---|---|---|
| Buffalo Sabres | 0 | 1 | 1 | 2 |
| San Jose Sharks | 0 | 0 | 0 | 0 |
Leaders
BUF
- ZB Zach Benson Goals1
-
 Owen Power
Assists2
-
Owen Power
Points2
Team stats
| BUF | SJ | |
|---|---|---|
| 20 | Blocked Shots | 12 |
| 16 | Hits | 35 |
| 5 | Takeaways | 8 |
| 41 | Shots Total | 23 |
| 0 | Power Play Goals | 0 |
| 3 | Power Play Opportunities | 3 |
| 0.0 | Power Play Pct | 0.0 |
| 0 | Short Handed Goals | 0 |
| 0 | Shootout Goals | 0 |
| 26 | Faceoffs Won | 32 |
| 44.8 | Faceoff Percent | 55.2 |
| 6 | Giveaways | 21 |
| 3 | Penalties | 3 |
| 6 | Penalty Minutes | 6 |