Ottawa Senators 5, San Jose Sharks 1
Ottawa Senators v San Jose Sharks
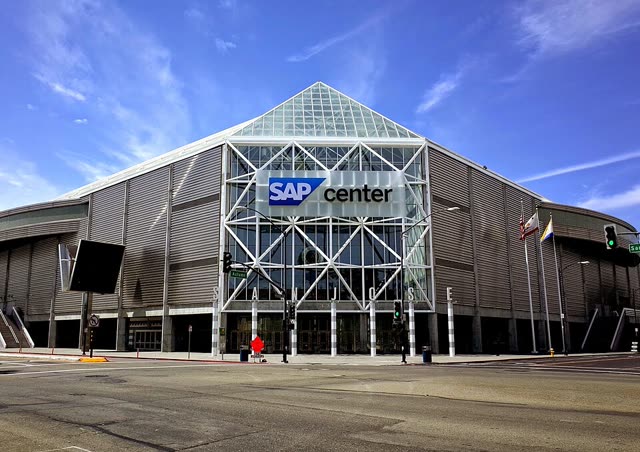
Final · SAP Center at San Jose · San Jose, CA · 16,138 in · line OTT -148 · o/u 6.5
| Team | 1st | 2nd | 3rd | T |
|---|---|---|---|---|
| Ottawa Senators | 1 | 3 | 1 | 5 |
| San Jose Sharks | 1 | 0 | 0 | 1 |
Leaders
OTT
-
 Shane Pinto
Goals1
-
 Jake Sanderson
Assists2
-
 Dylan Cozens
Points2
SJ
-
 Michael Misa
Goals1
-
 Jacob Trouba
Assists1
-
Michael Misa
Points1
Team stats
| OTT | SJ | |
|---|---|---|
| 9 | Blocked Shots | 18 |
| 14 | Hits | 24 |
| 4 | Takeaways | 2 |
| 35 | Shots Total | 23 |
| 0 | Power Play Goals | 0 |
| 3 | Power Play Opportunities | 3 |
| 0.0 | Power Play Pct | 0.0 |
| 1 | Short Handed Goals | 0 |
| 0 | Shootout Goals | 0 |
| 35 | Faceoffs Won | 27 |
| 56.5 | Faceoff Percent | 43.5 |
| 13 | Giveaways | 20 |
| 4 | Penalties | 5 |
| 8 | Penalty Minutes | 18 |